
Artificial Intelligence Can Detect Low-Glucose Levels via ECG Without Fingerprick Test
A new technique developed by researchers at the University of Warwick uses the latest findings of artificial intelligence to detect hypoglycemic events from raw ECG signals, via a wearable sensor
 Dr. Leandro Pecchia at the University of Warwick.Credit: University of Warwick
- Tracking sugar in the blood is crucial for both healthy individuals and diabetic patients. Current methods to measure glucose requires needles and repeated fingerpicks over the day. Fingerpricks can often be painful, deterring patient compliance.
- The technology works with an 82% reliability, and could replace the need for invasive finger-prick testing with a needle, which could be particularly useful for pediatric age patients
A new technology for detecting low glucose levels via ECG using a non-invasive wearable sensor, which with the latest artificial intelligence can detect hypoglycemic events from raw ECG signals has been made by researchers from the University of Warwick.
Currently, continuous glucose monitors (CGM) are available by the NHS for hypoglycemia detection (sugar levels into blood or derma). They measure glucose in interstitial fluid using an invasive sensor with a little needle, which sends alarms and data to a display device. In many cases, they require calibration twice a day with invasive finger-prick blood glucose level tests.
However, Dr Leandro Pecchia’s team at the University of Warwick published their results Jan. 13 in a paper titled ‘Precision Medicine and Artificial Intelligence: A Pilot Study on Deep Learning for Hypoglycemic Events Detection based on ECG’ in the Nature Springer journal Scientific Reports proving that using the latest findings of artificial intelligence (i.e., deep learning), they can detect hypoglycemic events from raw ECG signals acquired with off-the-shelf non-invasive wearable sensors.
Two pilot studies with healthy volunteers found the average sensitivity and specificity approximately 82 percent for hypoglycemia detection, which is comparable with the current CGM performance, although non-invasive
Dr. Pecchia, from the School of Engineering at the University of Warwick, comments:
“Fingerpicks are never pleasant and in some circumstances are particularly cumbersome. Taking [a] fingerprick during the night certainly is unpleasant, especially for patients in pediatric age.
 Credit: University of WarwickOur innovation consisted in using artificial intelligence for automatic detecting hypoglycemia via few ECG beats. This is relevant because ECG can be detected in any circumstance, including sleeping.”
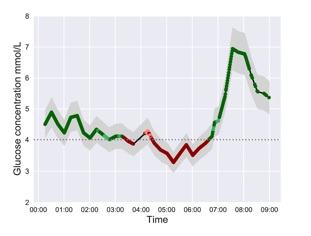
The figure to the left shows the output of the algorithms over the time: the green line represents normal glucose levels, while the red line represents the low glucose levels. The horizontal line represents the 4mmol/L glucose value, which is considered the significant threshold for hypoglycemic events. The grey area surrounding the continuous line reflects the measurement error bar.
The Warwick model highlights how the ECG changes in each subject during a hypoglycemic event. The figure below is an exemplar. The solid lines represent the average heartbeats for two different subjects when the glucose level is normal (green line) or low (red line). The red and green shadows represent the standard deviation of the heartbeats around the mean. A comparison highlights that these two subjects have different ECG waveform changes during hypo events. In particular, Subject 1 presents a visibly longer QT interval during hypo, while the subject 2 does not.
 Credit: University of Warwick
The vertical bars represent the relative importance of each ECG wave in determining if a heartbeat is classified as hypo or normal.
From these bars, a trained clinician sees that for Subject 1, the T-wave displacement influences classification, reflecting that when the subject is in hypo, the repolarization of the ventricles is slower.
In Subject 2, the most important components of the ECG are the P-wave and the rising of the T-wave, suggesting that when this subject is in hypo, the depolarization of the atria and the threshold for ventricular activation are particularly affected. This could influence subsequent clinical interventions.
This result is possible because the Warwick AI model is trained with each subject’s own data. Intersubjective differences are so significant, that training the system using cohort data would not give the same results. Likewise, personalized therapy based on our system could be more effective than current approaches.
Dr. Pecchia adds:
“The differences highlighted above could explain why previous studies using ECG to detect hypoglycemic events failed. The performance of AI algorithms trained over cohort ECG-data would be hindered by these inter-subject differences.
Our approach enable personalized tuning of detection algorithms and emphasize how hypoglycemic events affect ECG in individuals. Basing on this information, clinicians can adapt the therapy to each individual. Clearly more clinical research is required to confirm these results in wider populations. This is why we are looking for partners.”