Lab Manager | Run Your Lab Like a Business

How It Works

3D Cell Culture and Fluorescence Imaging

Assays using immortalized cell lines and plastic labware have been used for decades as an in-vitro mimic of how a putative drug may work in the human body. 

by BioTek
Register for free to listen to this article
Listen with Speechify
0:00
5:00

Close up of cell clusters

Problem: Assays using immortalized cell lines and plastic labware have been used for decades as an in-vitro mimic of how a putative drug may work in the human body. The last decade has seen attempts to improve the physiological relevance of these assays by the incorporation of human primary cells that better reflect human biology both from a drug efficacy and toxicity perspective. At issue with the use of primary cells is the relative difficulty in tissue culturing and maintenance for long-term studies relative to immortalized cell lines.


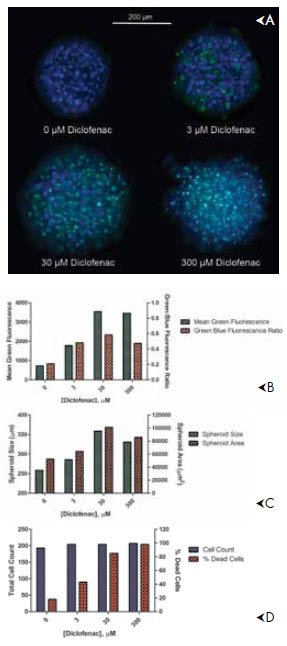
Solution: 3D cell culture methods that involve cell aggregation either by self-assembly into spheroids or the use of scaffolds to build tissue-like structures can enable long term experiments spanning a week or more. Peter Banks and Brad Larson of BioTek have shown that human hepatocytes demonstrate excellent plasma membrane integrity and enzyme activity (i.e. cytochrome P450, isotype 3A4) over a period of almost two weeks when contained in a spheroid liver microtissue. This allows for drug toxicity testing over the same period.

Images and image analysis of liver microtissue spheroidsFigure 1: Images and image analysis of liver microtissue spheroids after 10-day incubation under several doses of diclofenac. A: 10x images of spheroids showing live (blue) and dead (green) cells. B: Mean green fluorescence is computed from each pixel of the 16-bit CCD camera; green:blue fluorescence ratio is computed from mean fluorescence intensities of each channel. C: Spheroid size is the diameter of the spheroid and spheroid area represents the area drawn by Gen5 around the spheroid. D: Total cell count represents the total number of cells in the field of view using the blue fluorescence channel; % dead cells represents the percentage of the total cell count containing green fluorescence.The spheroids consist of aggregations of about 1,000 – 2,000 cells and have a diameter of about 200 – 400 μm. Larger size spheroids tend to necrosis due to the lack of nutrients accessing the core. Most assays involving spheroids are conducted in microplates where there is one spheroid/microplate well. Spheroids are small in relation to the well dimensions and only cover about 0.2 percent of the surface area at the bottom of a 96-well microplate. Using conventional PMT-based plate reader optics, assays utilizing spheroids tend to be problematic as these instruments are designed to capture as much light from the well as possible. This causes issues with background as the signal is confined to such a small part of the detection volume. Fluorescence microscopy, however, limits the field of view depending on the magnification desired and thus enhances signal to background ratios (S/B) allowing for robust assays. Furthermore, image analysis provides additional data for a better understanding of what is occurring in an experiment. Figure 1 illustrates this point, using the affect of the non-steroidal anti-inflammatory drug diclofenac on liver microtissue spheroids after ten days repeated treatment under various doses (0 – 300 μM). Images (Figure 1A) and image analysis (Figure 1B-D) were provided by BioTek Instruments’ Cytation 3 cell imaging microplate reader using its fluorescence microscopy module under 10x magnification.

Gen5 software’s image analysis capability allows the images to be processed in many ways, providing greater detail on how diclofenac affects the spheroid. The mean green fluorescence in the field of view can be plotted (Figure 1B), providing a relative impression of increasing toxicity based on the disruption of the plasma membranes of the cells comprising the spheroid. A fluorescence ratio of green (dead cell fluorescence) to blue (total cell fluorescence) can also be plotted, which yields a different profile at higher diclofenac concentration. These data are equivalent to that obtainable from PMT-based optics, but with improved S/B which suggests that diclofenac toxicity reaches a maximum at 30 μM. Ratiometric data is rather confusing as it suggests that diclofenac toxicity is inexplicably reduced at higher concentration. Upon examining the spheroid images in Figure 1A, it is evident that the spheroids are expanding with increasing diclofenac concentration. Gen5 can use image analysis routines to compute spheroid size, based on a diameter and spheroid area which is plotted in Figure 1C. Quantitative data indicate that the spheroids do increase in size up to 30 μM diclofenac, but at the highest dose, it appears the integrity of the spheroid is partially ruptured and the size and area is reduced. These data suggest an explanation for the ratiometric data seen in Figure 1B. Finally, cell counting in a focal plane that bisects the spheroid can be performed for both blue (live cell) and green (dead cell) fluorescence channels using Gen5. Quantitative data presented in Figure 1D indicates that while the total number of cells counted in the spheroids is consistent across all diclofenac concentrations, increasing toxicity is evident across the concentration profile of diclofenac reaching almost 100 percent toxicity at 300 μM.

Fluorescence microscopy and the image analysis capabilities of Gen5 provide multiparametric data that allows for a complete understanding of long-term diclofenac toxicity on spheroid microtissues.

For more information, visit www.biotek.com