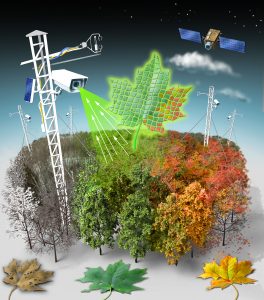
 The PhenoCam network uses imagery from digital cameras to track vegetation phenology in ecosystems across North America.llustration credit: Victor LeshykA new paper by Northern Arizona University professor Andrew Richardson published in the journal Scientific Data describes a vast network of digital cameras designed to capture millions of images documenting seasonal changes of vegetation across North America. The network, dubbed PhenoCam, is the result of a 10-year collaboration between Richardson, who led the effort, and scientists from the University of New Hampshire and Boston University to develop a reliable continental-scale observatory of phenological phenomena.
Vegetation phenology is what determines the seasonal events in the life cycle of plants, such as dormancy, budding, leafing, and flowering. Highly sensitive to climate change, phenology is an important indicator for understanding how ecosystem processes are affected by longer growing seasons brought about by warmer climates.
For example, in many temperate ecosystems, scientists have been observing earlier onset of spring and delayed onset of autumn since the 1970s. This extended growing season—which has the potential to increase plant photosynthesis and growth, and hence increase ecosystem productivity—also has implications for the global carbon cycle and levels of atmospheric carbon dioxide (CO2). Phenologically-driven increases in productivity could result in increased removal of CO2 from the atmosphere by plants, which would help to offset greenhouse gas emissions from burning fossil fuels. However, shifts in phenology can also affect ecosystems in other ways, such as increasing the phenological mismatch between plants and pollinators.

Historically, the methods available for measuring phenological changes across ecosystems have been less than ideal, and the lack of long-term, spatially extensive data has prevented scientists from making confident projections about phenological responses to future climate change. Until recently, phenological studies have typically consisted of human observers monitoring individual plants and recording visually apparent changes in the organism’s phenological state, such as budding or flowering. This approach is labor-intensive and difficult to standardize.
However, in 2006, Richardson and colleagues realized the daily pictures they were recording from atop a 90-foot tower at the Bartlett Experimental Forest in New Hampshire could be processed just like the images recorded by satellites. This led to the discovery that a simple “greenness index,” calculated from the red, green and blue color information stored in each image, could be used to track the phenological state of deciduous trees. The greenness index enabled precise identification of the timing of budburst and peak autumn colors. Richardson concluded that a network of automated cameras, snapping pictures every day, could offer a high-tech alternative to conventional, observer-based phenological monitoring.
Sheer volume and complexity of project called for “big data” solution
The PhenoCam network started with that single camera mounted at a forest research site in New Hampshire. The network now comprises more than 400 cameras installed at sites across North America, from Alaska to Florida and from Hawaii to Maine. Each camera is observing the seasonal rhythms of a specific patch of vegetation. But no longer is the focus just on temperate deciduous forests: network sites span a wide range of ecoregions, climate zones and plant functional types, and include tropical grasslands and coastal wetlands as well as arid shrublands and evergreen Boreal forests.
Imagery from the cameras is uploaded automatically to the PhenoCam server at least once daily—and in some cases as frequently as every 15 minutes. Richardson’s paper in Scientific Data is based on imagery collected through the end of 2015: approximately 15 million images, representing 750 years’ worth of data that requires 6 terabytes of disk space. Over the last two years alone, however, the PhenoCam image archive has doubled in size. Richardson’s team is working on catching up with the data processing and anticipates releasing a revised data set, with more than 1,500 years’ worth of data, within 12 months.

Advanced Lab Management Certificate
The Advanced Lab Management certificate is more than training—it’s a professional advantage.
Gain critical skills and IACET-approved CEUs that make a measurable difference.
“Because of the sheer volume of the images we’re capturing, processing and managing, this project called for a ‘big data’ solution,” said Richardson. In the field of technology, big data refers to extremely large and complex data sets that must be analyzed computationally to reveal patterns and trends needed for scientific study.
Richardson—who left Harvard University to join NAU in September—is an ecosystem scientist. He splits his time between the School of Informatics, Computing and Cyber Systems (SICCS) and the Center for Ecosystem Science and Society (Ecoss).
“One of the reasons I came to NAU was because of the focus on big data, so joining SICCS was exciting for that reason,” Richardson said.
SEGA joins PhenoCam network
NAU’s Southwest Experimental Garden Array (SEGA) recently joined the PhenoCam network. SEGA is a genetics-based research platform that enables scientists to quantify the ecological and evolutionary responses of species to changing climate conditions. The platform is an array of 10 garden sites arranged across a large elevation gradient in northern Arizona, including forest, chaparral, shrub, and desert grassland habitats. These ecosystem types are comparatively underrepresented in the existing PhenoCam image archive.
Interested in lab design?
Is the form not loading? If you use an ad blocker or browser privacy features, try turning them off and refresh the page.
By completing this form, you agree to receive news updates and relevant promotional content from Lab Design News. You may unsubscribe at any time. View our Privacy Policy
Through SEGA’s participation in PhenoCam, researchers using SEGA will be able to determine how day length, temperature, and precipitation govern plant growth stage transitions in different vegetation types at different scales, as well as predict how plant phenology in the Southwest will respond to rising temperatures and changing precipitation regimes.
PhenoCam images made available for public use
PhenoCam serves as a permanent record that can be visually inspected to determine the phenological state of the vegetation surveyed at any point in time. Richardson and his colleagues have made the data available for anyone to access and use on the PhenoCam site.
Although it was developed primarily for phenological model validation and development, evaluation of satellite remote sensing data products, benchmarking earth system models and studies of climate change impacts on terrestrial ecosystems, Richardson also notes that PhenoCam images will be useful to non-scientists in a variety of industries.
“Farmers in the Midwest can use data from the network to plan irrigation based on real-time monitoring, while in New England fall foliage enthusiasts can track autumn colors and plan a weekend trip based on where the colors are best,” he said. “PhenoCam images can also be viewed by armchair travelers to see what the landscape looks like in any given spot on the continent—when the aspen leaves are emerging in Flagstaff, what’s happening to vegetation in Minnesota or Michigan, for example.”
PhenoCam data to help refine continental-scale climate forecasts
Richardson, together with his collaborators from UNH and BU, have been using data from the PhenoCam network to refine computer models of plant-climate interactions, in tandem with International Panel on Climate Change (IPCC) climate projections, to understand how future climate change will influence different types of ecosystems across North America. The goal of this work has been to make forecasts about how future shifts in phenology will influence regional-scale carbon and water cycling.
This work has shown, for example, that extension of the eastern deciduous forest growing season will increase forest productivity but also water use, resulting in drier soils and reduced runoff. And, for the grasslands that dominate the Great Plains, enhanced productivity during the spring and fall shoulder seasons will be partially offset by drought-driven reductions in summertime productivity, which could present management challenges.
Researchers and citizen scientists invited to join the PhenoCam network of collaborators
The PhenoCam team is actively seeking new collaborators from the research community and tech-savvy citizen scientists. Collaborators are asked to follow PhenoCam project protocol to configure and deploy a standard recommended camera and provide important base information for the data collected. To learn more and to join the network, visit the FAQ page of the PhenoCam website at https://phenocam.sr.unh.edu/webcam/faq/.