Mass Spectrometry
Recent advancements in LC-MS/MS technology for enabling improvements in the multi-residue analysis of veterinary drugs in food
Authors Ed George1, Charles Yang1, Cristina Jacob1, Alan Atkins1, Dwayne Schrunk2, Laura E. Burns2 1Thermo Fisher Scientific; 2Veterinary, Diagnostic Laboratory, Iowa State University
Keywords
Veterinary drug residue analysis, QuEChERS, mzCloud Advanced Mass Spectral Database, LC-MS/MS, TSQ Quantis Plus, solvent sandwich injection technique
Goals
To demonstrate an improved analysis for selected veterinary drug residues in pork tissue extracts using a Thermo Scientific™ TSQ Quantis™ Plus triple quadrupole mass spectrometer along with:
A solvent sandwich injection technique for improved chromatography and sensitivity.
Integration of LC-MS with an on-line advanced mass spectral database to enable faster development of acquisition methods by direct importation of selected reaction monitoring transitions (SRMs) and optimized collision energies
Introduction
Veterinary drugs are administered to animals to ensure animal welfare. It is necessary to screen food products for veterinary drug residues at the maximum residue limits (MRLs) set by global regulatory agencies. This screening typically involves identification and quantification of veterinary drugs using LC-MS/MS.
Many publications and newer methodologies cite screening and quantification of large panels of multi-class veterinary drugs in a variety of matrices using a single or limited number of LC-MS/MS methods. An AOAC SMPR (standard method performance requirements) document published in 2018 described a large list of over 200 compounds required for routine monitoring at lowest global MRLs.1 As a result, a first action method for this SMPR was recently approved (AOAC 2020.04) covering the screening of 154 veterinary drug residues in a variety of matrices.2
Analyzing these large panels of multiple compound classes presents several challenges. Unlike pesticide residues, there is more diversity in the physicochemical properties of compounds analyzed, along with a wide range of MRL requirements based upon analyte/matrix combinations. For example, several hundred ng/g of one type of veterinary drug residue may be allowed in a specified matrix under a given regulation, and at the same time other analytes need to be quantified at low ng/g concentrations. The method must therefore employ a generic sample preparation and mobile phase combination that will inevitably be a compromise for some compounds in a method with a large scope. Another challenge is stability of mixed stock standards used for calibration and spiking samples, as well as stability of the final extract. Laboratories need to investigate whether adverse interactions between the analytes dissolved in standard mixtures are occurring, along with the best storage and solvent compositions required. Finally, a liquid chromatography system with an inert flow path and column capable of good separation and peak shape are critical for accurate quantification of the diverse group of analytes. Ideally, the method should be performed within 15 minutes, be applicable to multiple matrices, and provide comprehensive screening and quantification at or below regulated MRLs.
In this application note, we describe an instrument method for the quantitation of a diverse group of veterinary compounds spiked into pork muscle extract at concentrations equivalent to or below MRLs set in the China GB standard.3 Mobile phase composition, column, and injection techniques were optimized to provide the best separation, peak shape, and response for the analytes studied. Importantly, the liquid chromatography flow path was evaluated prior to analysis with a system suitability mixture containing multiple classes of veterinary drug residues that elute over the retention time range of the 15-minute chromatographic method. The method takes full advantage of the TSQ Quantis Plus triple quadrupole mass spectrometer’s advanced ion optics and fast polarity switching capability, which are critical for accurate quantification in high density SRM acquisition areas within the analytical run. In addition, we evaluate a novel feature within the instrument control software of the TSQ Quantis Plus that allows users to directly import SRMs into instrument acquisition methods with optimized collision energies from a highly curated on-line database known as mzCloud™.5 This allows a developer to rapidly evaluate other possible SRMs for an existing compound or easily develop new methods with additional analytes for multi-class veterinary drug residues.
Experimental
Sample preparation
Approximately 0.5 kg of organic ground and homogenized pork was purchased at a local grocery store. Two grams of tissue was added to a 50 mL polypropylene centrifuge tube. Next, 10 mL of acetonitrile was added followed by shaking for 10 minutes on a Fisherbrand™ Digital MultiTube Vortexer. The tubes were then centrifuged for 10 minutes at 4,000 rpm at 5 ºC. A brief freeze-out step was then applied at -20 °C for 10 minutes. The entire supernatant (approximately 10 mL) was transferred to a 15 mL glass test tube, then placed into a TurboVap™ LV solvent evaporator and evaporated to dryness at 40 °C. The sample was then reconstituted in 1.0 mL of 50:50 methanol/water, filtered through a 0.2 micron filter (Thermo Scientific™ Titan3™ nylon syringe filter, 17 mm, purple, P/N 42213-NN), and finally transferred into an amber 2 mL autosampler vial for LC-MS/MS analysis.
Standards and system suitability test (SST) solution
Forty-two neat veterinary drug standards characterizing several compound classes and representative of low quantitation levels required in the China GB standard were purchased from Sigma-Aldrich (St. Louis, MO) and dissolved in appropriate solvents to create individual stock solutions at a concentration of 1.0 mg/mL. It is important to note that some beta lactam antibiotics, for example penicillin G, were prepared in water and stored frozen to prevent rapid degradation. Storage at -20 °C or colder for all compound stock solutions is recommended.
A set of spiking standard mixtures for all veterinary drugs at 100, 10, and 1 μg/mL were prepared in 90:10 acetonitrile/water and stored at -20 °C. The pork final extracts after filtration, evaporation, and reconstitution were spiked at 0.01, 0.05, 0.1, 0.5, 1, 2, and 5 ppb to evaluate the instrument in terms of limit of detection (LOD), limit of quantitation (LOQ), repeatability, and calibration accuracy and linearity. The relative sample to solvent concentration ratio of 2 g to 1 mL was used, as specified in the China GB method.
A system suitability check standard containing 34 veterinary drugs in acetonitrile at a stock concentration of 1.0 mg/mL was developed by the Veterinary Diagnostic Laboratory at Iowa State University. A 50 ppb substock was prepared in 80:20 mobile phase A/mobile phase B (described on next page) and used to check peak shape, retention, and general inertness of the liquid chromatography system.
LC-MS/MS analysis
The LC-MS/MS system comprised a Thermo Scientific™ Vanquish™ Flex Binary UHPLC system interfaced with a TSQ Quantis Plus triple quadrupole mass spectrometer equipped with a heated electrospray ionization (H-ESI) probe. Chromatographic separation was carried out on a Thermo Scientific™ Accucore™ VDX column, 100 mm × 2.1 mm × 2.6 μm (P/N VDX-102130) at a constant temperature of 40 °C. Tables 1a-c describe the mobile phase composition with autosampler parameters, gradient, and mass spectrometer API source settings used for the analysis.
A solvent sandwich injection technique within a user defined program (UDP) available in the Vanquish Flex Split Autosampler with a 100 µL sample loop was used for injection of all samples, which allowed for larger injection volumes with improved peak shapes for most analytes.4 The sandwich injection CIP parameters are described in Table 2.
Data processing, instrument control software (ICSW), and on-line spectral library compound database
Data acquisition methods for the veterinary drug residues were created in ICSW version 3.4. It allows for direct importation of precursors, product ions, and optimal collision energies from the highly curated mzCloud advanced mass spectral compound database into a new or existing method. In addition, a dwell time prioritization feature is available, allowing a user to set dwell time priority for individual SRMs within a compound. This feature can improve limits of quantitation, giving additional dwell time to low abundance ions, by reducing dwell time to high abundance ions, or compounds which have much higher MRLs.
The acquired data were processed using Thermo Scientific™ TraceFinder™ 5.1 software, and Thermo Scientific™ Freestyle™ software was used for qualitative purposes.
Results and discussion
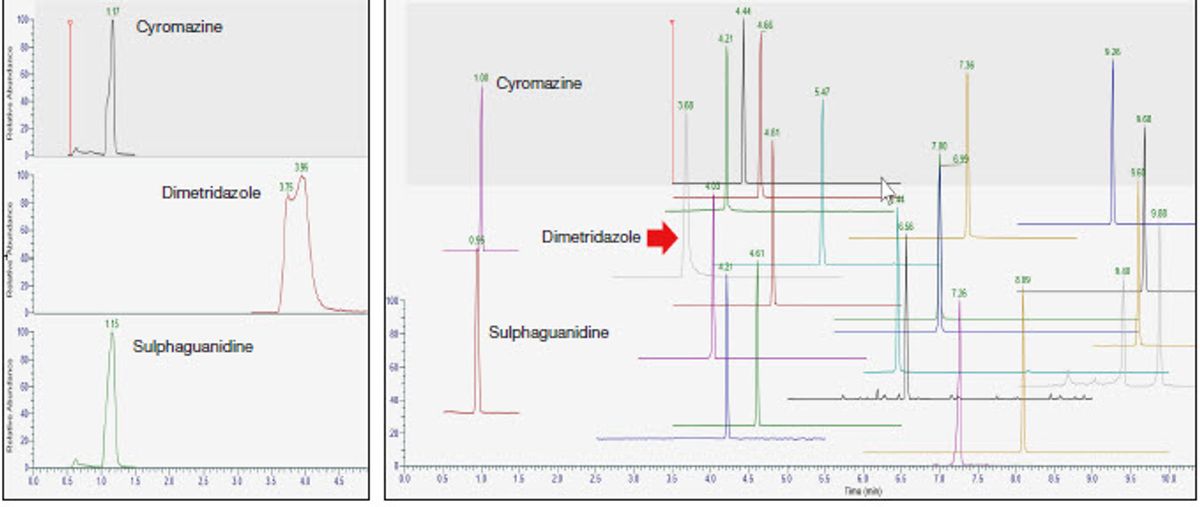
Use of a sandwich injection improves peak shapes when injecting larger volumes of extract, since stronger solvents like methanol and acetonitrile are required to keep analytes stable and in solution. Modern LC systems are designed to reduce dead volume through the sampling valve and syringe, resulting in a sharp solvent plug arriving at the head of the column. This is a problem if the starting conditions of a highly aqueous mobile phase do not match up with the extract composition. A sandwich injection works by bracketing the injected sample volume (8 μL) between mobile phase A plugs (38 μL for each solvent plug) that allows solvent mixing prior to the column head. The CIP parameters described in Table 1, along with in-needle mixing and a wider bore capillary (Thermo Scientific™ Viper™ Fingertight Capillary, 0.18 × 350 mm, MP35N, P/N 6042.2337) between the injection valve and column, demonstrate excellent peak shapes even for the very early eluting veterinary drug compounds cyromazine, dimetridazole, and sulphaguanidine (Figure 1). By increasing the volume of mobile phase A used for the sandwich injection plugs, better peak shape can be obtained for the earlier eluting compounds. It also potentially allows the user to inject more sample and maintain good peak shape. The in-needle mixing provides further agitation before it is injected. A user of this technique can easily optimize peak shapes over various injection volumes by running different methods in a sequence.
It is very easy to use when compared to more complex setups, such as dilution using switching valves or an extra in-line pump to add aqueous solvent post-injection.
Figure 1. An injection of a mixture of veterinary drugs in 80:20 mobile phase A:mobile phase B. Left: Peak shapes of earlier eluting peaks with a 5 μL injection and 20 μL plugs of mobile phase A surrounding the sample volume. Right: Peak shape improvement of earlier eluting peaks with an 8 μL injection and 38 μL plugs of mobile phase A surrounding the sample.
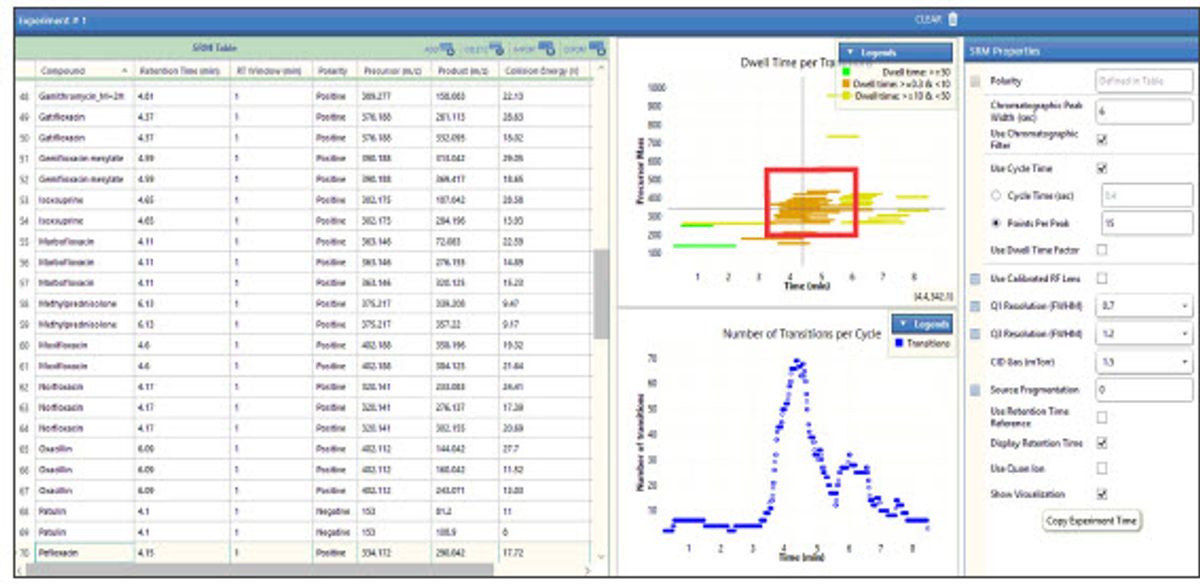
The TSQ Quantis Plus mass spectrometer provides key features that enable accurate detection and quantification of the target veterinary drug residues in the pork matrix. Fast polarity switching at 5 ms, combined with its advanced ion optics, enable excellent quantitation in densely populated regions of the chromatogram. As can be seen in Figures 2a and 2b, SRM density is greatest between 3 and 6 minutes. Figure 2b shows 8–12 scans across the peaks for accurate quantitation, even with polarity switching occurring over the same time range. Figure 3 demonstrates that reproducible ion ratios are also observed, which is critical as most regulations require specified ion ratio limits for identification of the residue. Five injections of the quantifier and qualifier ions are overlayed for isoxsuprine at 50 ppt spiked in the pork matrix.
Figure 2a. SRM visualization panel in the ICSW of the TSQ Quantis Plus. The red box highlights dense population of SRMs between 3–6 minutes. Polarity switching is also taking place during this time range.
Figure 2b. Stick scan view of SRMs shown in FreeStyle software helps visualize the number of scans across a chromatographic peak to ensure accurate quantification
Figure 3. Ion ratio stability overlay for 5 injections, m/z 284.2/107.04 at 50 ppt isoxsuprine in pork tissue
Method performance
The system suitability check helps ensure analyte response, peak shape, and LC analytical flow path inertness (minimal reactivity with target compounds) is acceptable prior to starting the run. Table 3 provides the compounds present in the mixture, along with retention times. The solvent sandwich injection and mobile phase gradient conditions described in Tables 1 and 2 were used, and as can be seen in Figure 4, excellent peak shape and response is observed for early, middle, and late eluting components.
Table 3. SST Compounds and retention times
Compound | Retention time |
| Compound | Retention time |
| Compound | Retention time |
Amprolium | 0.89 |
| Penicillin G | 4.25 |
| Fenbendazole | 6.71 |
Cyromazine | 0.96 |
| Sulfamethazine | 4.30 |
| Flunixin (M+H) | 6.99 |
Amoxicillin | 1.73 |
| Clenbuterol | 4.41 |
| Flunixin (M-H) | 6.99 |
Cefapirin | 3.81 |
| Florfenicol | 4.67 |
| Carprofen | 7.41 |
Levamisole | 3.86 |
| Carazolol | 4.73 |
| Melengesterol Acetate | 8.04 |
Lincomycin | 4.00 |
| Halofuginone | 4.93 |
| Decoquinate | 9.09 |
Tulathromycin | 4.16 |
| Chloramphenicol | 5.00 |
| Closantel | 9.39 |
Ciprofloxacin | 4.17 |
| Tilmicosin | 5.04 |
| Lasalocid | 9.67 |
Oxytetracycline | 4.18 |
| Tiamulin | 5.83 |
| Rafoxanide | 9.83 |
Ractopamine | 4.20 |
| Tylosin A | 5.84 |
| Monensin | 9.90 |
Carbadox | 4.21 |
| Albendazole | 5.96 |
| Ivermectin B1a | 9.99 |
Chlortetracycline | 4.22 |
| Betamethazone | 6.07 |
|
|
|
100 |
|
|
|
|
|
|
|
95 |
|
|
|
|
|
|
|
90 |
|
|
|
|
|
|
|
Figure 4. System suitability test (SST) mixture at 50 ppb for veterinary drug residues. Shown below are expanded views of the above extracted TIC.
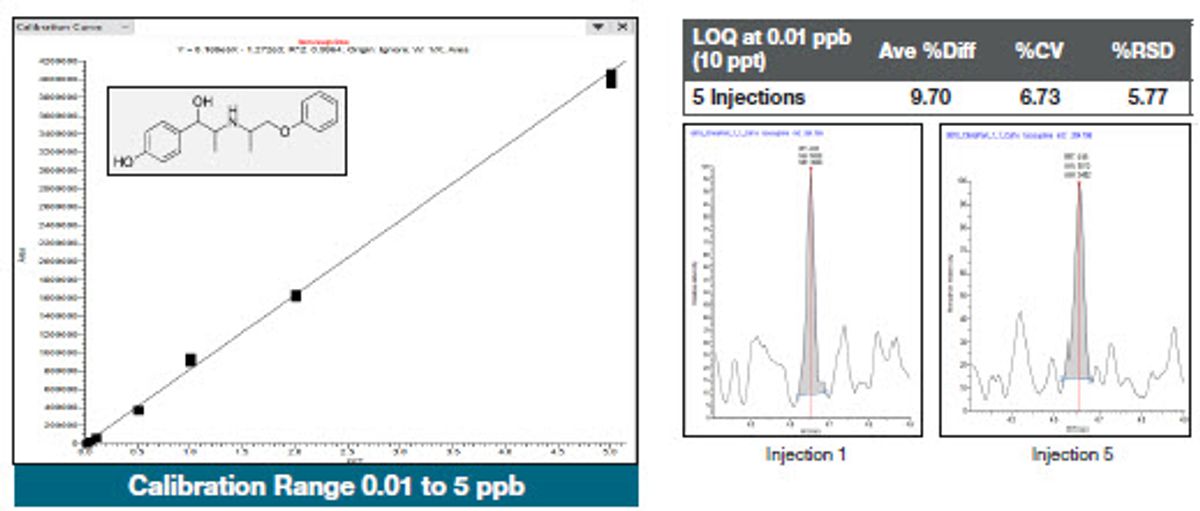
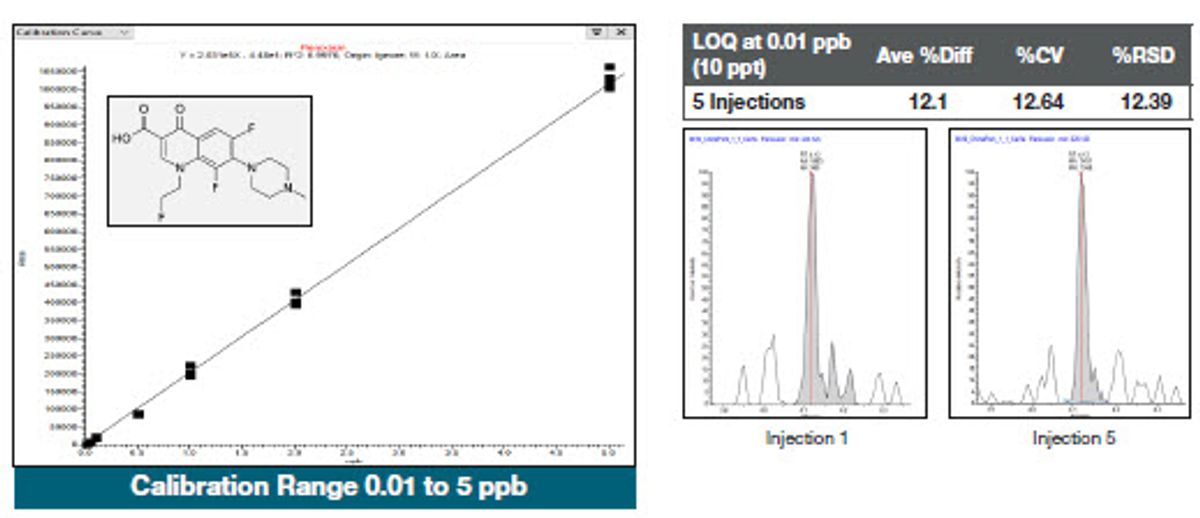
To assess the instrument response, calibration standards were spiked into the final pork extract ranging from 10 ppt to 5 ppb and analyzed with excellent linearity achieved, with correlation coefficients greater than 0.99 for over 95% of the compounds. Five replicates of the same extract were injected at each level. Figures 5, 6, and 7 show examples of representative calibration curves and quantitation statistics for the spiked extracts. Peaks shown on the right-hand side of each figure are at the LOQ level, with Coefficient of Variation (CV) and percent relative standard deviation (RSD) statistics listed above them. The percent difference is the average value of the five replicates calculated from the calibration curve compared to the expected (true) value. A percent difference of less than 20% at the LOQ demonstrates the accuracy of the measurement and provides confidence in the data.
Figure 5. Calibration curve and statistics for isoxsurine spiked into the pork extracts. Peaks shown on the righthand side of each figure are at the LOQ level, with CV, accuracy, and percent relative standard deviation (RSD) statistics listed above them.
Figure 6. Calibration curve and statistics for penicillin G spiked into the pork extracts. Peaks shown on the righthand side of each figure are at the LOQ level, with CV, accuracy, and percent relative standard deviation (RSD) statistics listed above them.
Figure 7. Calibration curve and statistics for fleroxacin spiked into the pork extracts. Peaks shown on the righthand side of each figure are at the LOQ level, with CV, accuracy, and percent relative standard deviation (RSD) statistics listed above them.
A summary of LODs and LOQs for all the compounds studied is presented in Figure 8. LOD is defined as the concentration with %RSD < 25%, and for the LOQ a concentration with %RSD <15%. In both cases, the percent difference between the calculated value from the calibration curve and true value are ≤ 20%. Most LOQs are below 0.5 ppb with the highest observed results for fluorohydrocortisone-acetate and prednisolone. It is likely that some compounds will exhibit poorer response if the mobile phase is not optimal (as is the case here), as well as the potential for degradation in the extracts. The method performs satisfactorily when the LOD and LOQ requirements in matrix are compared to the expected levels in the China GB standard (Table 3). Many of the concentrations listed in the GB standard are based upon a 20 µL injection volume depending on the matrix/commodity. In general, most analytes meet the requirements, with the exception of a couple steroid hormones, again likely due to either extract stability and/or mobile phase composition.
LOD and LOQ (ng/g or ppb) for target vet drugs spiked into pork extract
Figure 8. Summary of LODs and LOQs for all compounds studied based upon five replicate injections of spiked pork extracts. LOD is defined as the concentration with %RSD < 25%, and for the LOQ a concentration of %RSD <15%.
On-line mass spectral database for method development
With ever increasing demand for high sample throughput using triple quadrupole technology, rapid method development is critical for laboratories responding to new customer needs or expanding the scope of existing methods to meet changing regulatory requirements. Utilizing an advanced high-resolution mass spectral database, known as mzCloud (www.mzcloud.org), one can greatly reduce the time required to build SRM tables. This is accomplished by a software feature that directly imports the precursor ion and the most abundant product ions with corresponding optimal collision energies (CEs) directly into a triple quadrupole acquisition method. Compounds are continually being added to the database to address emerging research requests. The mzCloud database currently contains over 19,000 entries covering 16 different compound classes.
While Orbitrap-based mass spectrometers were used to generate the spectra in mzCloud, and the TSQ Quantis Plus mass spectrometers use different neutral collision gases, nitrogen (N2) and argon (Ar), respectively, the relative energetics for unimolecular fragmentation pathways will overlap generating similar product ions. To test the hypothesis, a set of veterinary drugs was analyzed using direct infusion of pure standard solutions to determine up to three product ions, collision energy settings per product ion, and the resulting production ratios. Then, similar SRM transition information was imported directly from the mzCloud database using a conversion equation to establish the resulting CE value per product ion transition. No further method optimization was performed on the experimental values per SRM transition as determined from mzCloud.
Figure 9 compares the response between the SRM method derived from experimentally optimizing via a classic infusion experiment and SRMs imported from mzCloud. A very high correlation is observed between the two methods, in terms of product ions selected, CEs, and the intensity of SRMs. Importing from mzCloud can dramatically decrease method development times, and methods can even be developed when analytical standards are not available or prohibitively costly.
The goal of developing targeted SRM transitions is to identify the best sets of precursors and products that ensure selectivity, specificity, and sensitivity. For small molecules, optimal SRM transitions could result from either positive or negative mode, as shown Figure 9. In addition, some compounds preferentially form adducts that can modify unimolecular dynamics, creating new product ions that may be more selective and sensitive, while maintain specificity relative to the matrix. Compound entries into the mzCloud database account for each of these cases, and the importing software routine introduced on the TSQ Quantis Plus mass spectrometers reads in multiple instances enabling the user to determine which SRM transition sets are optimal by performing minimal experiments.
Figure 9. Overlay of extracted ion chromatograms for flunixin (XIC) of a) SRMs generated by infusion of an analytical standard and experimentally determined product ions and CEs, b) SRMs generated by importing from mzCloud, c) The HCD breakdown curve from mzCloud, with precursor ion de-selected
Table 4. Calculated instrument LODs and LOQs obtained from the final pork spiked extracts as compared to the expected levels in the China GB standard and AOAC SMPR. For some compounds listed in the table, the LOD/LOQ data reflects values from different matrices and/or different agency regulations.
Compound name | GB standard requirement LOD (ng/g) | GB standard requirement LOQ (ng/g) | TSQ Quantis Plus LOD (ng/g) in pork | TSQ Quantis Plus LOQ (ng/g) in pork | AOAC Lowest Global MR (ng/g) |
Ritodrine | 0.5 | – | <0.025 | 0.025 | ** |
Isoxsuprine | 0.5 | – | <0.005 | 0.005 | ** |
Penicillin G | 0.5 | – | 0.005 | 0.025 | 50 |
Oxacillin | 1.0 | – | <0.25 | 0.25 | 30 |
Danofloxacin | 1.0/0.5 | 3.0/2.0 | 0.005 | 0.025 | 30 |
Sarafloxacin | 2.0/1.0 | 6.0/3.0 | 0.05 | 0.25 | 10 |
Pipemidic acid | 2.0/1.0 | 6.0/3.0 | <0.25 | 0.25 | ** |
Pefloxacin | 2.0/1.0 | 6.0/3.0 | 0.025 | 0.05 | ** |
Norfloxacin | 2.0/1.0 | 6.0/3.0 | <0.05 | 0.05 | ** |
Enoxacin* | 3.0/1.5 | 10.0/5.0 | NA | NA | ** |
Ciprofloxacin | 2.5/1.2 | 8.0/4.0 | <0.025 | 0.025 | ** |
Thiamphenicol | 0.3 | 1.0 | <0.25 | 0.25 | 50 |
Florfenicol | 1.0 | – | 0.05 | 0.25 | 100 |
Florfenicol amine** | 0.3 | 1.0 | NA | NA | 200 |
Sodium cyclamate | 20.0 | 100.0 | 0.05 | 0.25 | ** |
Prednisone | 0.2 | – | 0.5 | 1 | 0.7 |
Cortisone | 0.2 | – | <0.5 | 0.5 | ** |
Methylprednisolone | 0.2 | – | <0.05 | 0.05 | 2 |
Betamethasone | 0.2 | – | 0.025 | 0.05 | 0.3 |
Beclomethasone | 1 | – | 0.25 | 0.5 | ** |
Fluorohydrocortisone acetate | 1 | – | 0.5 | 1 | ** |
Methyl testosterone | 0.5 | 0.4 | <0.05 | 0.05 | ** |
Stanozolol | 0.5 | 0.4 | <0.005 | 0.005 | ** |
Testosterone | 0.5 | 0.4 | 0.05 | 0.25 | ** |
Trenbolone | 0.5 | 1 | 0.025 | 0.05 | 2 |
Gamithromycin | – | 0.1 | <0.005 | 0.005 | 20 |
Tilmicosin | 2.0 | – | <0.025 | 0.025 | 50 |
Chlormadinone | – | 0.5 | 0.05 | 0.25 | 2.5 |
*Enoxacin degraded in the substock spiking standard and was not detected in the extracts.
**Florfenicol amine was not detected in the pork extract due to co-elution with high amounts of matrix.
Conclusion
‘Universal’ large veterinary drug residue methods are challenging to develop because generic column, mobile phase, and sample preparation conditions are applied to the screening of samples containing diverse chemical classes at wide ranging concentrations in various tissue matrices. The method described here brings together critical tools to help accomplish this goal:
An optimized mobile phase and an inert LC system checked using an SST solution with solvent sandwich injection capability uniformally improves peak shape and sensitivity due to increased sample injection volumes.
The TSQ Quantis Plus triple quadrupole mass spectrometer with fast polarity switching (5 ms), advanced ion optics for fast SRM scan rates, and excellent performance at very short dwell times provides high quality quantitative and qualitative results in densely populated areas of the chromatogram.
An on-line, highly curated advanced mass spectral database (mzCloud) enables easy method development with access to over 19,000 unique compounds, allowing direct import of optimized CEs with SRM precursor and product ions into acquisition methods using a simple software tool.
The results of the veterinary drug residues spiked into the pork extracts demonstrate excellent instrument LOD and LOQ relative to the requirements described in the China GB method, demonstrating that it is fit for purpose and can easily be expanded in scope.
References
Screening and Identification Method for Regulated Veterinary Drug Residues in Food. https://www.aoac.org/wp-content/uploads/2019/09/SMPR2018_010.pdf
Screening of 154 Veterinary Drug Residues in Foods of Animal Origin Using LC–MS/MS: First Action 2020.04. https://academic.oup.com/jaoac/ article-abstract/104/3/650/6044156
National Food Safety Standard on Maximum Residue Limits for Veterinary Drugs in Foods (GB 31650-2019). https://food.chemlinked.com/database/view/1661
Thermo Scientific Application Note 73186: Improving peak results using a custom injection program to reduce solvent strength prior to sample injection. https://assets. thermofisher.com/TFS-Assets/CMD/Application-Notes/an-73186-lc-results-custom- injector-reduce-solvent-strength-an73186-en.pdf
mzCloud – Advanced Mass Spectral Database. https://www.mzcloud.org/
Learn more at thermofisher.com
For Research Use Only. Not for use in diagnostic procedures. © 2022 Thermo Fisher Scientific Inc. All rights reserved. TurboVap is a trademark of Biotage. All trademarks are the property of Thermo Fisher Scientific and its subsidiaries unless otherwise specified. an000508-na-en 0122S


