
In addition to managing the day-to-day operations and challenges of their laboratories, laboratory managers are now confronted with an increasingly volatile budgeting process. When compared to the early part of last decade, which was shaped by dependable and steady growth, the past three years are easily characterized as uncertain and, at times, tumultuous with numerous market swings. The economic stimulus package and a relaxation of purchasing freezes in late 2009 and early 2010 seemed to indicate a return to normalcy. Nevertheless, there are few signs signifying that annual increases in research and development spending will return to their historical levels of 5% to 10%, at least not any time soon. To better ascertain the spending trends among laboratories, the editors of Lab Manager Magazine and Frost & Sullivan recently conducted a survey of 146 Lab Manager Magazine readers who were qualified as decision makers who either influence or approve their laboratory purchasing policies. Survey respondents primarily include laboratory managers, department managers, laboratory directors, laboratory technicians, and principal investigators at academic institutions, hospitals or clinical laboratories, biotechnology companies, and chemical or petrochemical companies globally.


Flat budgets abound
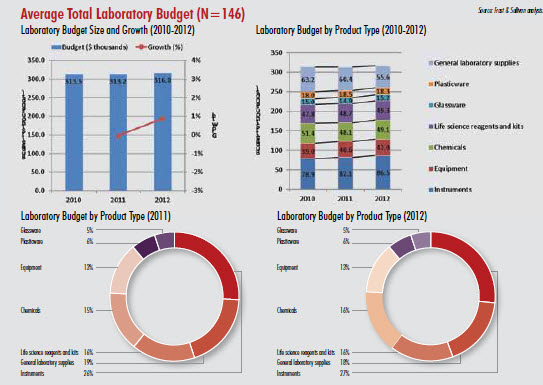
When spending levels increased in late 2009 and 2010, general sentiments were that a recovery was taking place. In retrospect, it seems that a lot of this spending was the result of pent-up demand: excessively conservative laboratories were left with depleted inventories and instruments or equipment that was in dire need of replacement. Moreover, the infusion of approximately $10 billion in federal stimulus funding for research—provided through the American Recovery and Reinvestment Act of 2009—further inflated expectations and promoted unjustified optimism. While spending increases in 2010 were similar to or higher than increases seen in 2007 and earlier, 2011 by comparison is flat. In 2010, the average total laboratory budget among the 146 Lab Manager Magazine readers surveyed was $313,500. Representing a slight decline, their budgets averaged $313,200 in 2011. The outlook for 2012 is not terribly positive as survey respondents expect only a modest increase of roughly 1%, to $316,000. The explanation for the spending slowdown is consistent: budget cuts. The reasons for these cuts, however, are varied. Respondents cite the general recession, reductions in state or city funding, the falling number of federal grants, and consolidation due to corporate mergers and takeovers as the reasons for their reduced spending power.
The majority of spending—over 60%—is on consumables: chemicals, life science reagents and kits, glassware, plasticware, and general laboratory supplies. Investment in these products is expected to remain stable between 2011 and 2012, with as much as 19% of budgets allocated to the purchase of general laboratory supplies, 16% allocated to the purchase of chemicals, 16% allocated to the purchase of life science reagents and kits, 6% allocated to the purchase of plasticware, and 5% allocated to the purchase of glassware. Despite the rising costs of raw materials essential to the production of consumables, laboratories set aside a relatively constant portion of their budgets for these products. While vendors are eager to raise consumables pricing to cover their increasing manufacturing costs, laboratories have successfully leveraged their buying power to minimize price increases.
Instruments and equipment make up as much as 40% of the remaining spending, with up to 27% of budgets allocated to the purchase of instruments and 13% allocated to the purchase of equipment. Instruments are the single largest expense of laboratories, with the average instrument budget totaling over $82,000 in 2011. Survey respondents recognize that a larger investment in more sophisticated instrumentation with greater sensitivity and higher throughput can improve their laboratories’ efficiencies by enhancing analytical capabilities, expanding applications, or reducing costs associated with staffing or sample volumes. Accordingly, survey respondents plan to boost spending on instrumentation by 5.4% in 2012, raising their average instrument expenditure to $86,500.
Fluctuations in product spending
General laboratory supplies—products such as filtration membranes, gloves, wipes, clothing, absorbents, dispensers, cans, syringes, and disposable bioreactors—are the largest consumables expense. On average, surveyed laboratories allocated $60,400 toward the purchase of these products. However, given the wide diversity of general laboratory supplies, a product-specific analysis was not conducted. Among all product categories, budget cuts are expected to have the greatest impact on spending for general laboratory supplies. Compared to 2010, average spending for these products declined by 4.4% in 2011, and in 2012, surveyed laboratories are planning for another 7.9% cut.
On average, laboratories spend $48,700 on life science reagents and kits, the second-largest consumables expense. While survey respondents’ budgets for life science reagents and kits increased by only about 1.9% in 2011, sales of these products are generally viewed as one of the fastest-growing product categories, given biopharmaceutical companies’ and academic institutions’ increased focus in genomics research and protein biomarker discovery. Life science reagents and kits are the least commonly employed laboratory products, with only 70% of respondents (N=103) claiming to have used them in 2011. However, this represents a sizable increase over 2010, when only 54% of respondents (N=79) used life science reagents and kits in their laboratories. Average budgets for immunochemicals, cell culture reagents, and nucleic acid research reagents are similar at $10,700, $9,700, and $8,800, respectively. Protein research reagents and cell analysis research reagents warrant smaller average investments of $4,900 and $3,900, respectively, and an average of $11,200 is allocated to the purchase of all other life science reagents and kits.
Spending on chemicals, which averaged $48,100 in 2011, is the third-largest consumables expenditure among surveyed laboratories. Respondents reduced the portion of their budget allocated to chemicals purchases by 6.4% in 2011—the greatest decrease among all product categories. However, respondents plan to increase their chemicals purchases by 2.1% in 2012. The decline in 2011 is likely attributable to an overstocking of chemicals in 2010—a result of an overcorrection in purchasing during the previous downturn year. Standard laboratory chemicals, such as solvents, acids, standards, and dyes, make up the far majority of chemicals spending: in 2011, survey respondents spent an average of $34,600 on standard chemicals. Laboratories plan to spend the remainder of their chemicals budget on organic/ research chemicals ($8,200), separation chemicals ($3,800), and other chemicals ($1,400).
Budgets for plasticware averaged $18,500 in 2011, a 2.8% increase over the previous year. Respondents expect their 2012 plasticware budgets to undergo a small contraction of 1.1% in 2012. Most of this spending is on liquid-handling plasticware, for which respondents budgeted approximately $10,200. Other plasticware purchases include cell culture and bioprocessing plastic and high-throughput screening plasticware, which averaged $4,800 and $1,500, respectively. However, average budgets for the latter two categories of plasticware are considerably higher among biopharmaceutical laboratories.
The average budget for glassware, the final consumables product category, totaled $14,900 in 2011, a 0.7% decline compared to 2010. In 2012, respondents expect their glassware budget to increase by roughly 2%. Glassware purchases have been declining for several years, independent of the economic downturn in 2008 and 2009. Nevertheless, glassware is still critical to laboratory processes, especially reusable glassware, for which respondents’ budgets averaged $8,300. Other glassware purchases include disposable glassware and specialty glassware, for which respondents’ budgets averaged $4,000 and $2,200, respectively.

Large capital expenses, including instrument and equipment purchases, were drastically cut in 2009. Budgets for these high-value items were often the first to be cut, frozen, or eliminated. As a result, the economic downturn had a far greater impact on instrument and equipment budgets than on any other laboratory product. After over a year of being forced to make do with obsolete technologies, a large number of laboratories eagerly made purchases in 2010 with reinvigorated instrument and equipment budgets. While 2011 increases were not as high as 2010 increases, respondents reported that both instrument and equipment budgets went up by 4.1% last year. Respondents also plan for instrument and equipment budgets to go up again in 2012—by 5.4% and 3.4%, respectively.
In 2011, respondents set aside an average of $12,300 for the purchase of chromatographers, which was the single greatest instrument investment. Following chromatographers, the next greatest instrument expenses include $9,000 for microscopy systems, $7,400 for spectrophotometers, and $7,400 for balances. Respondents’ instrument purchases were very fragmented: an average of $28,700 was budgeted for instruments other than those mentioned. Refrigerators and freezers are respondents’ leading equipment expenditure, with an average of $6,000 reserved for their purchase. Respondents budget between $2,000 and $3,000 for other pieces of equipment, such as water systems, ovens, pumps, baths, hot plates, and evaporators.
Laboratories are usually self-sufficient when it comes to the maintenance of their instruments and equipment. When asked who is responsible for providing service and repair, respondents regularly selected “Myself/My department”—56% for the service of their instruments and 57% for the service of their equipment. Respondents more heavily rely on their manufacturer service contract for the service and repair of their instruments; 59% of respondents use an instrument manufacturer service contract compared to only 30% of respondents who use an equipment manufacturer service contract. Instead of relying on their manufacturer, 41% of respondents depend on their in-house service department for the service and repair of their equipment, whereas only 34% of respondents depend on in-house service for their instruments
Outlook for 2012 and 2013
For the most part, laboratories should expect to see their budgets remain flat in 2012 and the outlook for 2013 is not much better. A United States Senate panel approved a 2012 spending bill that would trim the National Institutes of Health (NIH) budget by 0.6%, or $190 million. Moreover, the White House Office of Management and Budget (OMB) is asking federal departments and agencies to plan for 2013 budgets that are 5% and 10% below 2011 discretionary spending levels. Given recent austerity measures and the continued economic slowdown, funding for research and development in Europe and Japan is likely to be trimmed by similar amounts. Consequently, laboratories that depend on government funding will have to find ways to further slash their budgets.

The two-year outlook for private-sector research and development laboratories is not as bleak: global biopharmaceutical revenues continue to grow at rates of 5% and higher. Similarly, contract research organizations (CROs) expect their compound annual growth rate to exceed 8% between now and 2017. These indicators bode well for the laboratories that support pharmaceutical companies, biotechnology companies, and CROs. Private-sector laboratories outside the life sciences also can expect some growth in their budgets. For example, as petroleum costs steadily increase at around 6% annually, the laboratories that support the petrochemical and chemical industries can expect similar budgetary increases.
As survey respondents point out, the leading events and factors that influence laboratory spending are the endless call for new projects and technological advances. The mix in spending between various product categories will continue to fluctuate given the cyclical stocking of laboratory inventories combined with the replacement of instruments and equipment. Overall, the decline in government funding and the modest growth in private-sector funding should offset each other, resulting in an average laboratory budget that grows no more than 2% in 2012 and 2013.


