A Framework for Specific, Measurable, Achievable, Relevant, and Time-Based, Performance Goals
Many organizations encourage the use of SMART (Specific, Measurable, Achievable, Relevant, Time-Based) goals. There are many guides readily available, but they tend to be general, with no laboratory-specific examples.1,2
Some contain a sample laboratory SMART goal but are otherwise general.3 A guide exists to help lab managers use SMART goals to manage their own time4 but not that of their lab or their direct reports. Preliminary work on lab-specific SMART goals is not widely available.5,6 A previous article discussed development of SMART laboratory goals.7 This work discusses the results for analysts and supervisors of SMART laboratory goals up to two years after implementation.
Analytical laboratory key performance indicators typically include accuracy, precision, and turnaround time. To support and motivate analysts to excel in all three, goals were developed using the QC (quality control) data generated daily:
- Accuracy–agreement of Certified Reference Material (CRM) QC samples assay with CRM certificate of analysis
- Precision–% RSD of assay duplicates, one per batch
- Turnaround–% compliance with required turnaround time
Goals for accuracy, precision, and turnaround are required to motivate all desired behaviors. Neglecting any of these may lead to undesired behavior, e.g., improved turnaround at the expense of accuracy. The targets in the goals were based on external (to the laboratory), scientifically justifiable criteria.7 Supervisors’ individual goals were a composite of their personal scores for the above three goals along with those of their direct reports, so supervisors were motivated to maximize team performance.
SMART accuracy goal
The Accuracy goal is shown in Table 1. The key laboratory assay used PTC-1a8 CRM as a QC sample. The intervals in Table 1 are based on the CRM 95% confidence intervals. 7 Samples were assayed by aqua regia digestion with inductively coupled plasma (ICP) spectrometry finish.
| SCORE ↓ | % Ni | % Cu |
|---|
Table 1 - SMART Accuracy Goal| PTC=1a Certified Values -> | 10.03 ± 0.07 | 13.51 ± 0.11 |
| 5 | 9.89 - 10.10 | 13.40 - 13.62 |
| 4 | 9.82 - 10.17 | 13.29 - 13.73 |
| 3 | 9.75 - 10.25 | 13.18 - 13.84 |
| 2 | 9.68 - 10.32 | 13.07 - 13.95 |
| 1 | 9.61 - 10.39 | 12.96 - 14.06 |
| 0 | Outside above range | Outside above range |
SMART precision goal
The Precision goal is shown in Table 2. The goal measured the %RSD for assay duplicates, with one assay duplicate per batch of samples.
| Score | Ni and Cu Average % RSD |
|---|
Table 2 - SMART Precision Goal| 5 | ≤ 1 |
| 4 | 1 - 1.5 |
| 3 | 1.5 - 2 |
| 2 | 2 - 2.5 |
| 1 | 2.5 - 3 |
| 0 | > 3 |
SMART turnaround goal
The lab Turnaround goal is shown in Table 3. Turnaround time was tracked in LIMS for each analyst.
| Score | Compliance |
|---|
Table 3 - SMART Turnaround Goal| 5 | 95% |
| 4 | 90% |
| 3 | 85% |
| 2 | 75% |
| 1 | 50% |
| 0 | < 50% |
Results and discussion
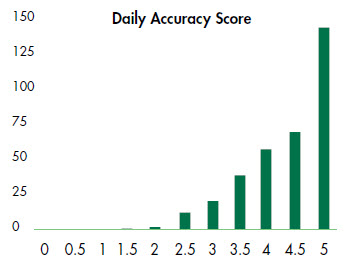
Figure 1 - Cu Year 0 Accuracy Scores
Figure 1 shows the laboratory Cu Accuracy scores for year 0 QC data used to develop the Accuracy goal. Figure 2 shows the Ni Accuracy scores for year 0 data. Figure 3 shows the combined Ni and Cu Accuracy scores assessed using the criteria in Table 1.
Figure 1 shows a narrow Gaussian distribution for Cu scores, with an average of 4.4. This is a high average. Most Cu assays resulted in a score of 5/5.
Figure 2 - Ni Year 0 Accuracy Scores
Figure 2 shows a broad Gaussian distribution for Ni scores, with an average of 3.1. This average is low to acceptable, depending on organizational standards. The goal could not be said to be easy for Ni.
The combined Ni and Cu scores shown in Figure 3 display a Gaussian distribution of moderate width and an average score of 3.7, and is preferred to either Ni or Cu alone. If the goal had been based solely on Ni, one might consider whether the criteria were too strict.
Figure 3 - Ni and Cu Year 0 Combined Accuracy Scores
If this was deemed to be the case, with organizational standards dictating a higher average, the intervals in Table 1 could be widened until the desired average and distribution were obtained. As scores improved, intervals could be decreased in subsequent years.
Figure 4 - Cu Year 1 Accuracy Scores
Figure 4 shows the year 1 Accuracy goal scores for Cu. Results can be easily broken down by analyst, so managers can focus attention where needed.
Figure 5 shows the year 1 scores for the Accuracy goal. Results were averaged daily for Ni and Cu scores, hence the non-integer entries. The year 1 average was 4.3 vs. 3.7 in year 0. The Accuracy goal clearly motivated an immediate and significant improvement in laboratory accuracy.
Figure 5 - Ni and Cu Year 1 Combined Accuracy Scores
Because the average score jumped to 4.3, was the goal too easy after one year? No external, scientifically justifiable case could be made for making this goal harder. Accuracy cannot be better than the CRM 95% confidence interval. Arbitrarily decreasing the intervals in Table 1 would only serve to demonstrate to staff that they can never achieve 5/5 and would thus be alienating rather than motivating. The analysts in question were experienced, diligent, and high performing before development of these SMART goals. The accuracy results confirm this prior assessment and demonstrate the value of a clear, proactive, and discriminating goal, which provides both the motivation and the tools required for continuous improvement.
For the Precision goal, the year 0 average was 4.2/5. The year 1 average increased to 4.6/5. These averages are high, and consideration was given to arbitrarily decreasing the intervals in Table 2 to make the goal harder. It was found that even minor interval decreases dramatically reduced the number of daily 5/5 results, dramatically decreasing analyst scores and making it impossible to achieve an annual score of 5. The conclusion is that experienced, diligent, and high-performing analysts were motivated to improve precision from good to excellent, thus accomplishing the purpose of the goal. Arbitrarily making the goal harder than its external, scientifically justifiable criteria was investigated and was found to make the goal unachievable. The goal would thus become non-SMART, and demotivating rather than motivating. Goals should motivate staff to reach an achievable, high standard that is relevant to lab success, rather than keep changing arbitrarily so that 5/5 is not achievable.
For the Turnaround goal, the year 0 average was 82% compliance, or a score of 2/5. The year 1 average increased to 90%, or 4/5. The goal thus succeeded in motivating desired behavior relevant to lab, customer, and business success. The goal could be made harder by increasing the percent compliance ratios for 5/5 from 95% to 98%, for example.
The goal could also be made harder by decreasing the turnaround time from the customer requirement of 4 hours. Not only was there no business need to do so, but doing so would encourage speed at the possible expense of accuracy and precision, and would stress and alienate staff.
Table 4 shows the long-term annual laboratory averages for the three SMART goals. Accuracy and Turnaround scores increased continuously, with relative improvements of 22% and 20% respectively after two years. The immediate and continuing improvement in scores indicates that the SMART goals empowered analysts to continuously improve. Analysts commented that the goals challenged them to constantly improve. The Precision score improved by 10% relative in the first year and leveled out thereafter. In light of the demonstrated intrinsic motivation, empowerment, and continuing improvement demonstrated by the Accuracy and Turnaround scores, the Precision goal evidently empowered analysts to reach their potential. That the analysts were already considered to be experienced and high performing when these SMART goals were developed and implemented demonstrates the power of QCbased SMART goals to drive improvements in laboratory key performance indicators that had not been achieved through other means.
| Accuracy (5) | Precision (5) | Turnaround (5) |
|---|
Table 4 - Long-Term SMART Goals Scores| Year 0 | 3.70 | 4.2 | 82% (2) |
| Year 1 | 4.30 | 4.6 | 90% (4) |
| Year 2 | 4.51 | 4.6 | 98% (5) |
SMART goal concerns
New analysts (a new analyst and two students hired after year 2) typically started with relatively low scores. Initial low scores usually improved with varying amounts of supervisor/manager training and mentoring, combined with critical self-assessment and the immediate feedback inherent in these SMART goals. New analysts were reminded that they were assessed after one year, so as not to be discouraged by initial low scores. They were also reminded that the experienced analysts took multiple years to reach their potential. To prevent discouragement from goals seeming unachievable, new analysts may need more relaxed goal tolerances than are used for experienced analysts. Tolerances may also need to be relaxed in case of unforeseen circumstances outside analyst control. The purpose of the SMART goals is to empower and enable, so analysts should not be penalized for circumstances outside their control.
Limit the number of goals. Focus, primacy, and impact decrease as the number of goals increases. Use the minimum number of goals required to motivate all organization-critical behaviors. If this results in more than a couple of goals, limit the number of target behaviors or use other means to motivate those desired behaviors.
Involve staff in goal development. They will be more than happy to tell you what they think is realistic and achievable, identify ways in which the goal may be misunderstood, and suggest negative behaviors that may be unintentionally motivated. Consulting staff during goal development decreases resistance to and resentment of the new goals and improves morale and engagement.
Use of QC data is not a panacea for developing SMART goals. Projects and nontechnical behaviors, e.g., safety, may not be amenable to the use of QC data. Other SMART metrics must be developed in such cases.
Not all desired behavior can be captured in a couple of SMART goals. SMART goals are just one tool to attain organization goals. Other mechanisms exist for motivating desired behaviors, such as salary increases, recognition and awards, professional development, special assignments, promotions, gifts, praise, etc.
Conclusions
Laboratory data can be readily used to develop SMART goals. Analysts always know exactly how they are doing, and can (and do!) take steps daily to improve. Managers can monitor staff progress in real time and intervene as appropriate. There are no surprises or disagreements over goal progress or status. Midyear and end of year reviews are quick, simple, and stress-free.
“Motivation improves when people have control over their own feedback. The best leaders willingly arrange for others to track their own progress. This sense of freedom leads to motivation and commitment.”9 SMART goals based on QC data motivated immediate, significant, and continuing improvements in analyst and laboratory accuracy, precision, and turnaround that had not been achieved through other means, and resulted in high staff morale and retention.
References
1. Fermilab Management Practices Seminar Quick Guide to Goal Setting, http://wdrs.fnal.gov/elr/goal_setting_2009.pdf, accessed February 4, 2015.
2. Goal Setting, http://www.stratishealth.org/documents/HITToolkitclinic/1.Adopt/1.2Plan/1.2HIT_Goal_Setting.doc, accessed February 4, 2015.
3. Guide to Goal Setting, Harvard University, Faculty of Arts & Sciences, http://hr.fas.harvard.edu/files/fas-hr/files/fy14_fas_guide_to_goal_setting_9.23.13_v2.pdf, accessed February 4, 2015.
4. Generate More Time Using S.M.A.R.T. Goals, http://www.labmanager.com/management-tips/2011/02/generate-more-time-using-s-m-a-r-tgoals, accessed February 4, 2015.
5. K. Headrick. SMART Analytical Lab Employee Incentive Goals. 63rd Pittsburgh Conference and Exposition on Analytical Chemistry and Applied Spectroscopy, Orlando, FL, March 11 - 15, 2012; invited paper no. 650-4.
6. K. Headrick. SMART Laboratory Employee Goals. Chemical Industry Digest, Volume 26, August 2013, pp. 86 - 90, invited paper.
7. K. Headrick. The SMART Lab, Part I, Lab Manager, June 2015.
8. PTC-1a Certificate URL: http://www.nrcan.gc.ca/minerals-metals/sites/www.nrcan.gc.ca.minerals-metals/files/files/pdf/tech-tech/PTC-1a-eng.pdf.
9. W. Hauck. Performance Conversations: How to Deliver Feedback Effectively. Lab Manager Magazine October 2013, pp. 20-21, http://www.labmanager.com/management-tips/2013/10/performance-conversations-how-to-deliver-feedback-effectively.
Part I of this article was published in the June 2015 issue of Lab Manager. www.labmanager.com/SMART-Lab