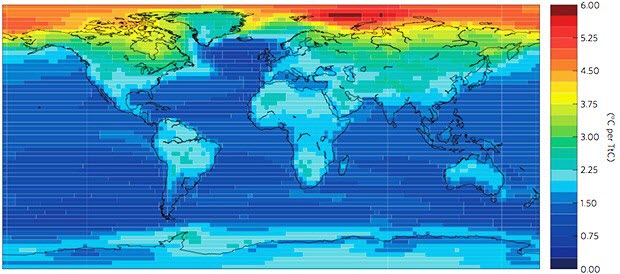
 This map illustrates the average temperature increases worldwide, shown in °C warming per teratonne of carbon in CO2 emissions.Image courtesy of Leduc, Matthews, Elía, Nature Climate ChangeEarth’s temperature has increased by 1°C over the past century, and most of this warming has been caused by carbon dioxide emissions. But what does that mean locally?
A new study published in Nature Climate Change pinpoints the temperature increases caused by CO2 emissions in different regions around the world.
Using simulation results from 12 global climate models, Damon Matthews, a professor in Concordia University’s Department of Geography, Planning and Environment, along with post-doctoral researcher Martin Leduc, produced a map that shows how the climate changes in response to cumulative carbon emissions around the world.
Related article: Climate-Smart Agriculture Still Lags After Paris
They found that temperature increases in most parts of the world respond linearly to cumulative emissions.
“This provides a simple and powerful link between total global emissions of carbon dioxide and local climate warming,” says Matthews. “This approach can be used to show how much human emissions are to blame for local changes.”
Leduc and Matthews, along with co-author Ramo´n de Eli´a from Ouranos, a Montreal-based consortium on regional climatology, analyzed the results of simulations in which CO2 emissions caused the concentration of CO2 in the atmosphere to increase by 1 per cent each year until it reached four times the levels recorded prior to the Industrial Revolution.
Related article: Goods Manufactured in China not Good for the Environment, Study Finds
Globally, the researchers saw an average temperature increase of 1.7 ±0.4°C per trillion tonnes of carbon in CO2 emissions (TtC), which is consistent with reports from the Intergovernmental Panel on Climate Change.
But the scientists went beyond these globally averaged temperature rises, to calculate climate change at a local scale.
At a glance, here are the average increases per trillion tonnes of carbon that we emit, separated geographically (view the full table here):
- Western North America 2.4 ± 0.6°C
- Central North America 2.3 ± 0.4°C
- Eastern North America 2.4 ± 0.5°C
- Alaska 3.6 ± 1.4°C
- Greenland and Northern Canada 3.1 ± 0.9°C
- North Asia 3.1 ± 0.9°C
- Southeast Asia 1.5 ± 0.3°C
- Central America 1.8 ± 0.4°C
- Eastern Africa 1.9 ± 0.4°C
“As these numbers show, equatorial regions warm the slowest, while the Arctic warms the fastest. Of course, this is what we’ve already seen happen—rapid changes in the Arctic are outpacing the rest of the planet,” says Matthews.
Related article: Study: Melting Glaciers Have Big Carbon Impact
There are also marked differences between land and ocean, with the temperature increase for the oceans averaging 1.4 ± 0.3°C TtC, compared to 2.2 ± 0.5°C for land areas.
“To date, humans have emitted almost 600 billion tonnes of carbon,” says Matthews. “This means that land areas on average have already warmed by 1.3°C because of these emissions. At current emission rates, we will have emitted enough CO2 to warm land areas by 2°C within 3 decades.”