Analytical Instruments

The open-source software is the first metabolite identification tool that can distinguish between stereochemical variants
| 2 min read

Deep learning can help in characterizing materials by analyzing peak changes in x-ray diffractions
| 2 min read

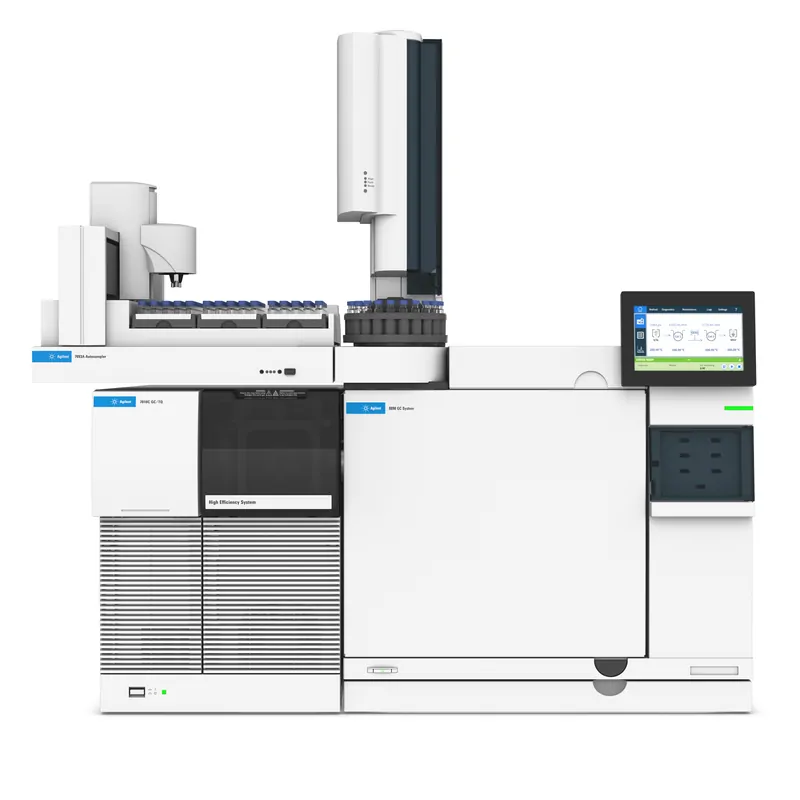
A new hydrogen carrier gas electron ionization (EI) source designed to improve chromatographic efficiencies for your gas chromatography/mass spectrometry (GC/MS) workflow
| 4 min read

The Agilent 7000E triple quadrupole GC/MS provides unequivocal intelligence and robustness to deliver the answers you seek.
| 2 min read
The Agilent 7010C triple quadrupole GC/MS is the most sensitive instrument of the Agilent GC/TQ portfolio that is powered by ultimate mass spec intelligence.
| 1 min read

Optical microscopes offer ease of use but have limited resolving power. SEMs use a beam of focused high-energy electrons to produce information about the specimen including morphology, chemical composition, and crystalline structure
| 1 min read

There are many different configurations of mass spectrometers available depending on the sample type being analyzed and the resolution and speed of analysis required
| 1 min read

Researchers can benefit from the high performance of a rotary vane pump without oil leaks
| 1 min read

Unlock sensitivity gains that reveal new, rare, or even previously undetected information with this high-resolution accurate mass system combining the power of Zeno trap with electron activated dissociation (EAD) fragmentation technology.
| 1 min read

Building on a long track record of innovation, the Agilent 5977C GC/MSD is the latest in the series of most trusted single quadrupole GC/MS instruments
| 2 min read

Recent technological leaps improve sustainability, uniformity, and control in imaging at a reduced cost
| 2 min read

New microscopy modality can see electric currents, detect fluctuating magnetic fields, and even see single molecules
| 3 min read